

 Русский
 中文
中文
 Español
 Deutsch
 Português
 日本語
日本語
 StockSharp
Release notes 12/8/2022
{{entity:product:80}} (v5.0.126): MoreLinq removed. {{entity:product:75}} (v5.0.129): ss-238: plaza: update spectra stream scheme cgate client lib log restored MoreLinq removed. {{entity:product:1082}...
 Pannipa
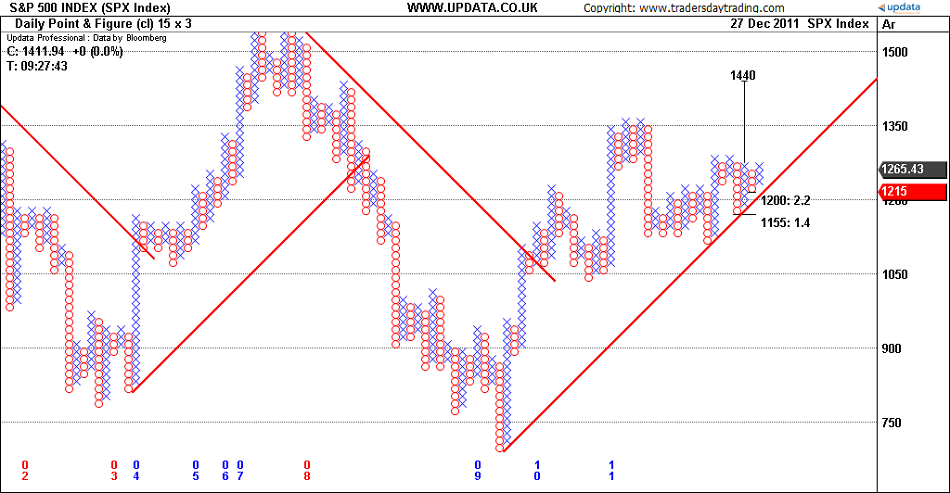
Trend line drawing Price Targets and Technical Analysis that traders should know in the diagram Point-and-Figure
Point-and-Figure-Chart-7.png image-25.png 💥The Point-and-Figure diagram is a popular tool among technical analysts and traders for charting price movements in financial markets. It is a type of chart...
 Pannipa
What patterns are the buy signals and sell signals technical analysis of support and resistance for traders to see in the Point-and-Figure diagram?
9eb85c0b550e1877ce51e70db80f52ea--to-read-charts.jpg d0abd6ee-f31c-4e01-95dc-cd03de9f4eae.png b09223ca-7e94-42ac-b1e7-a769735a6b19.png Point-Figure-Chart-Explained.jpg In Point-and-Figure charting, tr...
 Pannipa
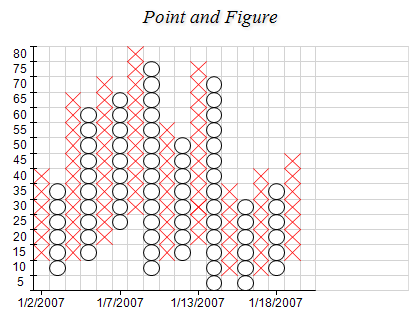
How to make a diagram Point-and-Figure and technical analysis to take advantage of chart trading?
PointAndFigure.png To make a Point-and-Figure diagram and use technical analysis to take advantage of chart trading, you can follow these steps: Select a reliable charting software that provides Point...
Pannipa
Point-and-Figure diagram - TOC
{{entity:topic:24193}} {{entity:topic:24195}} {{entity:topic:24201}} {{entity:topic:24207}}
 Pannipa
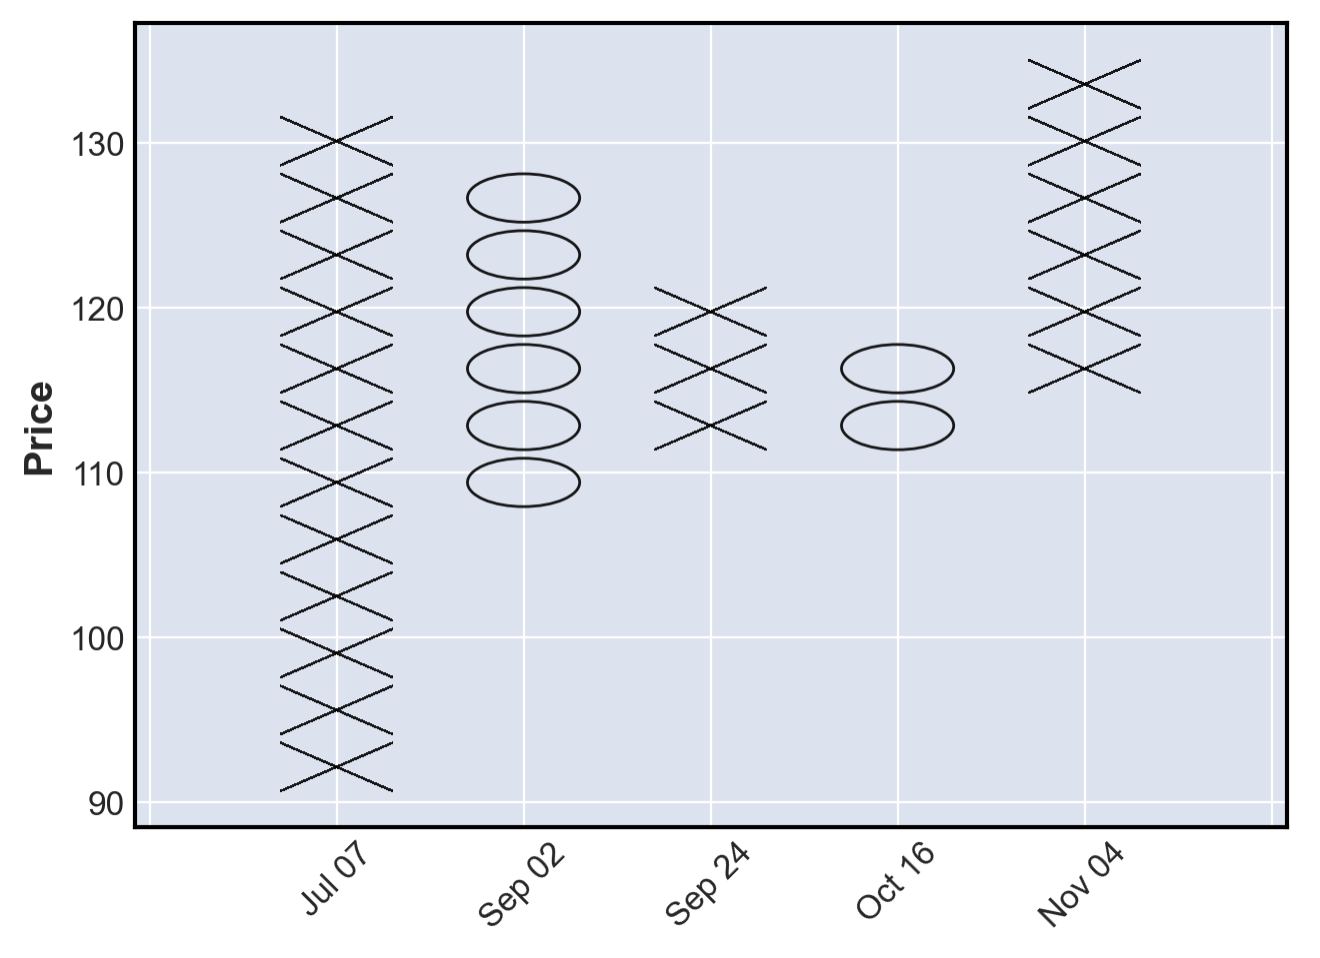
Let's get acquainted with chart technical analysis tools. Point-and-Figure
1*03ly9-LoF1WLHXsxPcVEPQ.png 💥Point-and-Figure (P&F) diagrams are a type of chart used in technical analysis to plot price movements without regard to time. The chart is made up of a grid of X's and ...
 Pannipa
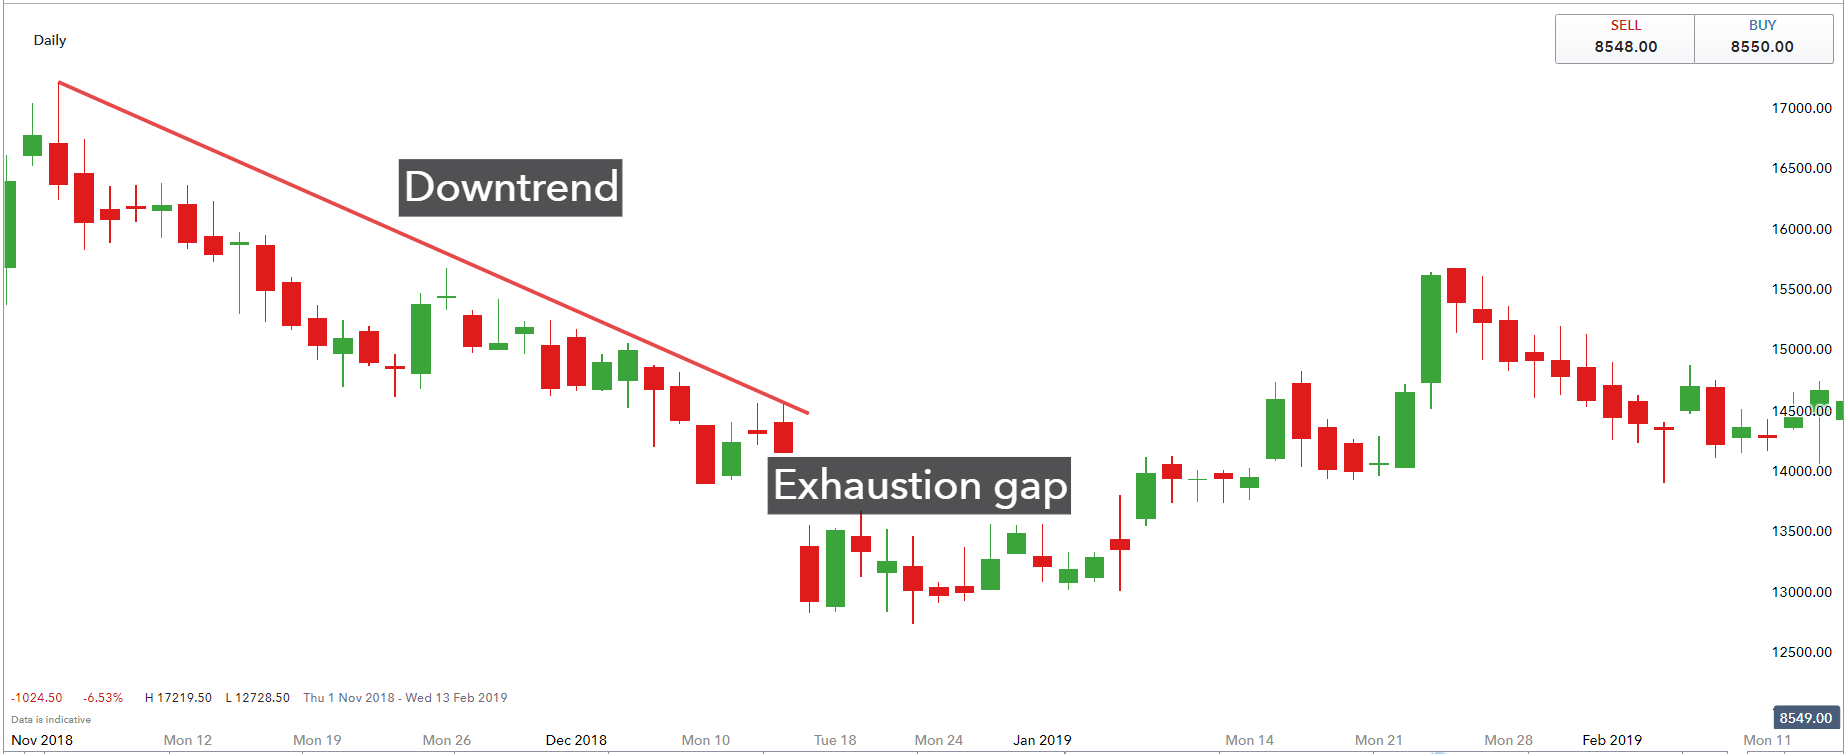
Exhaustion Gap Signals and Technical Analysis Principles for Utilizing Trends in this Gap
Gaps_Chart_6.png 💥An exhaustion gap is a type of gap that signals a potential end to the current trend. It occurs after a prolonged move in the market and represents a final push by investors to buy ...
Pannipa
Gap Patterns - TOC
{{entity:topic:24176}} {{entity:topic:24180}} {{entity:topic:24181}} {{entity:topic:24183}} {{entity:topic:24192}}
Pannipa
Continuous Patterns - TOC
{{entity:topic:24142}} {{entity:topic:24144}} {{entity:topic:24150}} {{entity:topic:24151}} {{entity:topic:24156}} {{entity:topic:24160}} {{entity:topic:24163}} {{entity:topic:24165}} {{entity:topic:2...
Pannipa
Reversal Patterns - TOC
{{entity:topic:24126}} {{entity:topic:24129}} {{entity:topic:24127}} {{entity:topic:24131}} {{entity:topic:24134}}
Pannipa
Technical analysis - TOC
{{entity:topic:24094}} {{entity:topic:24097}} {{entity:topic:24100}} {{entity:topic:24101}} {{entity:topic:24103}} {{entity:topic:24105}} {{entity:topic:24106}} {{entity:topic:24115}} {{entity:topic:2...
 Pannipa
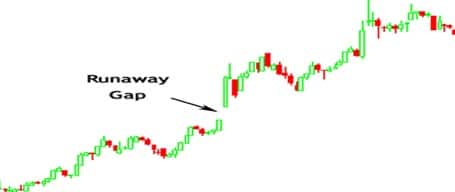
Let's get to know Runaway Gap and see what signals this gap gives traders
Image6482019.jpg 💥A runaway gap, also known as a measuring gap or continuation gap, is a type of gap that occurs in the middle of a trend. It is usually seen as a signal that the current trend is lik...
 Pannipa
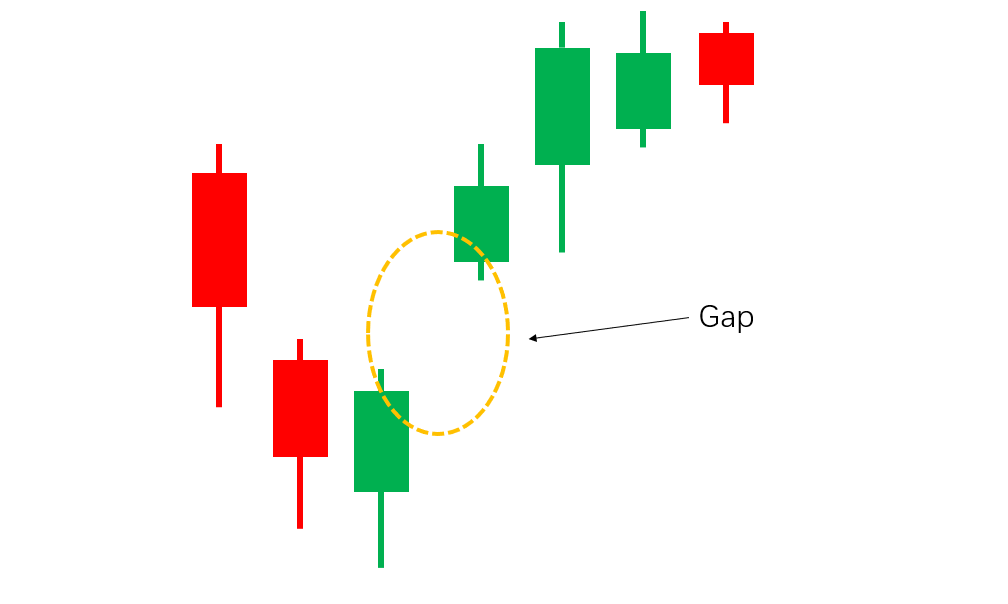
How importance of breakaway gaps and using breakaway gaps as support and resistance in trading?
19_2_eab104de75.png 💥Breakaway gaps are significant in technical analysis because they are usually formed at the start of a new trend, indicating a significant shift in market sentiment. They occur w...
 Pannipa
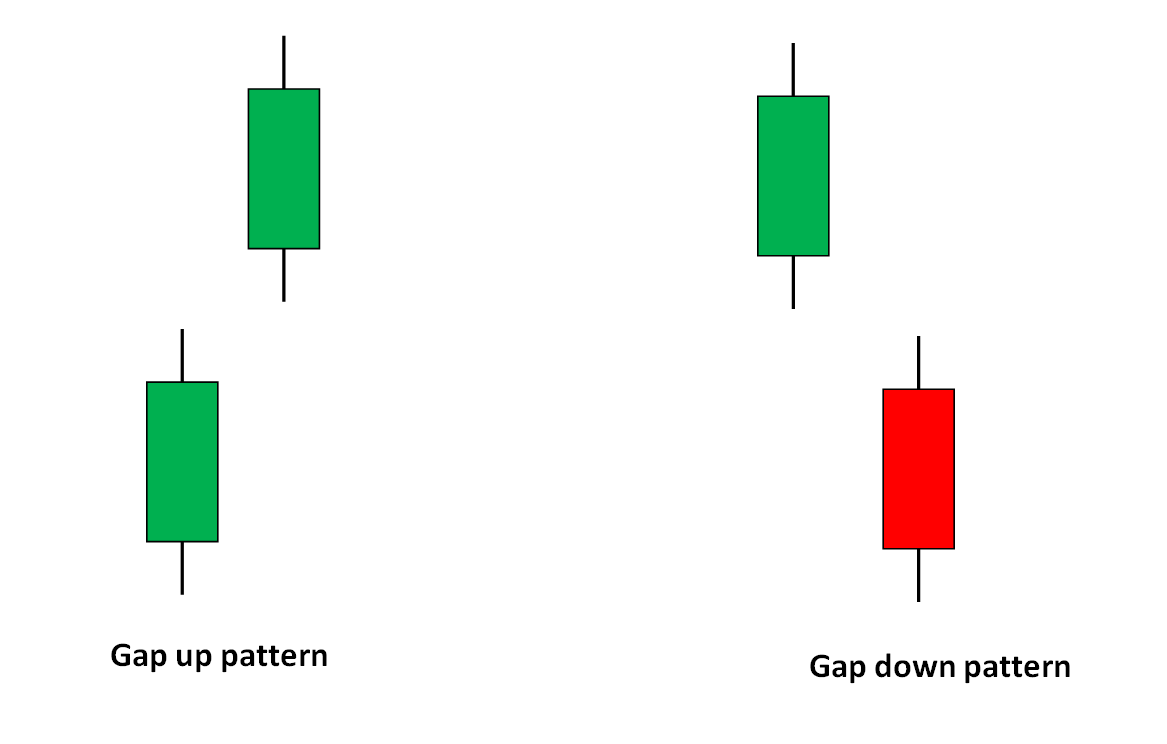
How are common gaps formed and how are they important in technical analysis?
💥Common gaps are formed when there is a slight pause in trading activity or a trading range, and the price opens above or below the previous day's closing price without any significant news or events...
 Pannipa
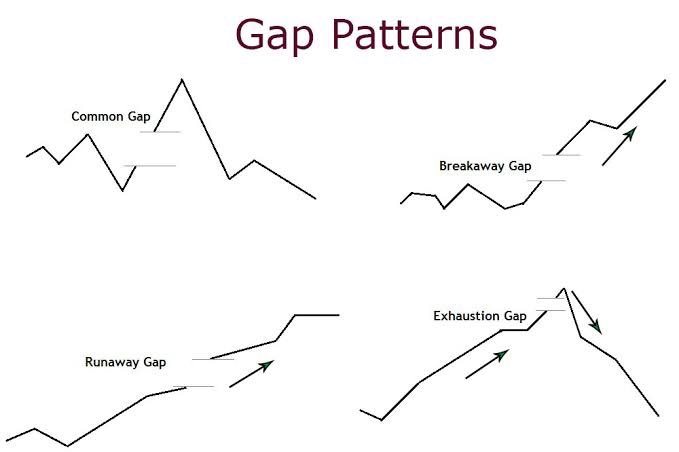
What about Gaps Patterns?
💥Gaps are a common phenomenon in financial markets that can indicate significant price movements. A gap occurs when there is a difference between the closing price of a trading day and the opening pr...
 Pannipa
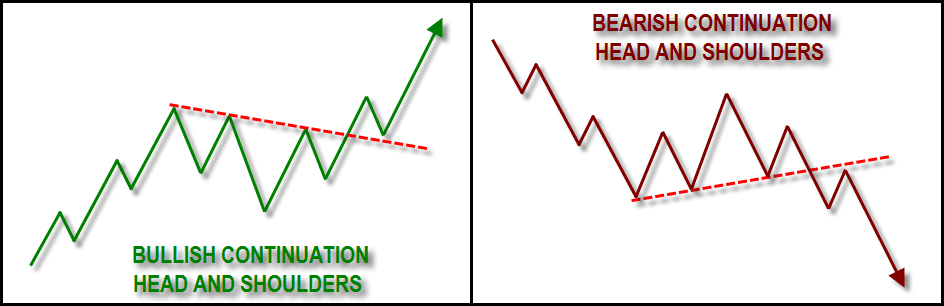
Continuous Patterns (Inverted Head & Shoulders)
💥The inverted head and shoulders pattern is a chart pattern that signals a potential reversal of a downtrend. It is formed by three lows, with the middle low (the head) being lower than the other two...
 Pannipa
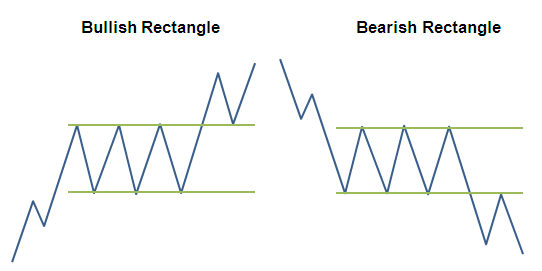
Continuous Patterns (Rectangle)
💥A rectangle is a chart pattern that signals a period of consolidation in the price movement of an asset. The pattern is formed when the price moves between parallel support and resistance levels, cr...
 Pannipa
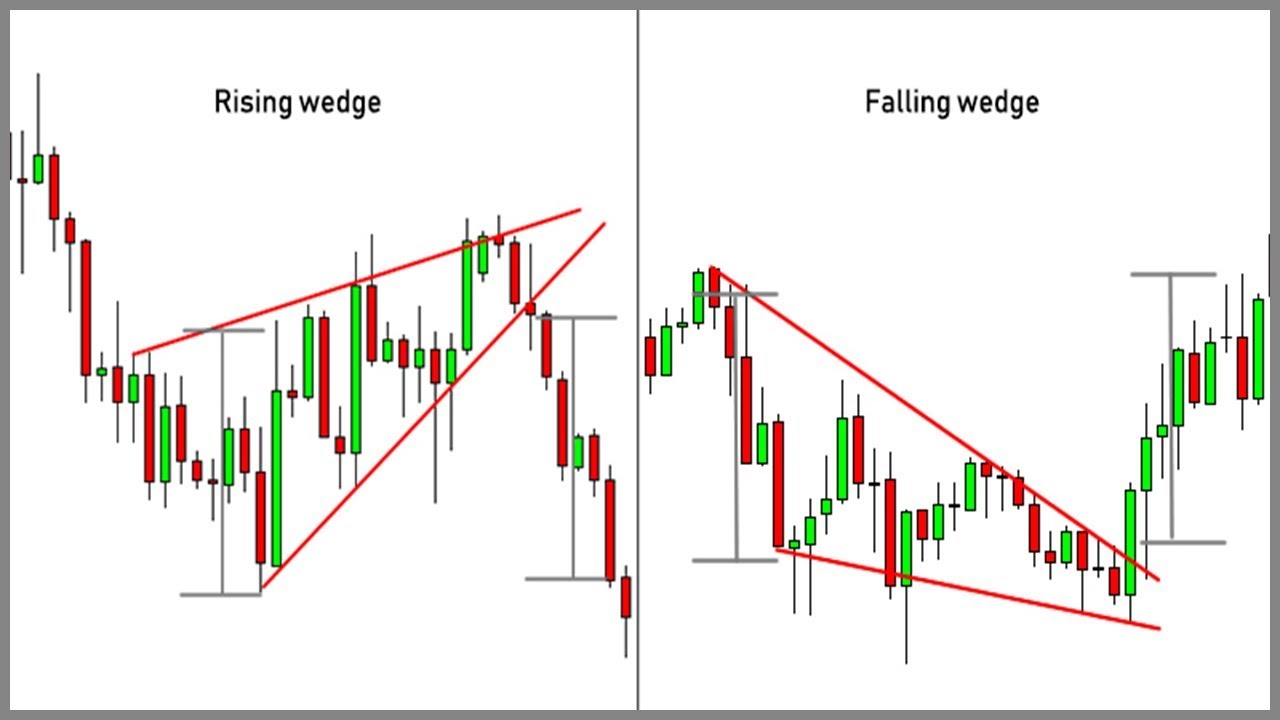
Continuous Patterns (Wedge)
💥A wedge is a chart pattern that signals a potential trend reversal or continuation. It can be either a rising wedge or a falling wedge. 💥A rising wedge is formed when the price consolidates between...
 Pannipa
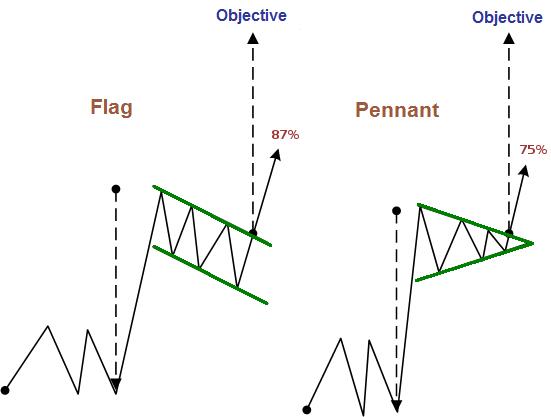
Continuous Patterns (Flags and Pennants)
💥Flags and Pennants are two chart patterns that can occur during a trend, typically after a significant price movement. They are classified as continuation patterns as they suggest that the previous ...